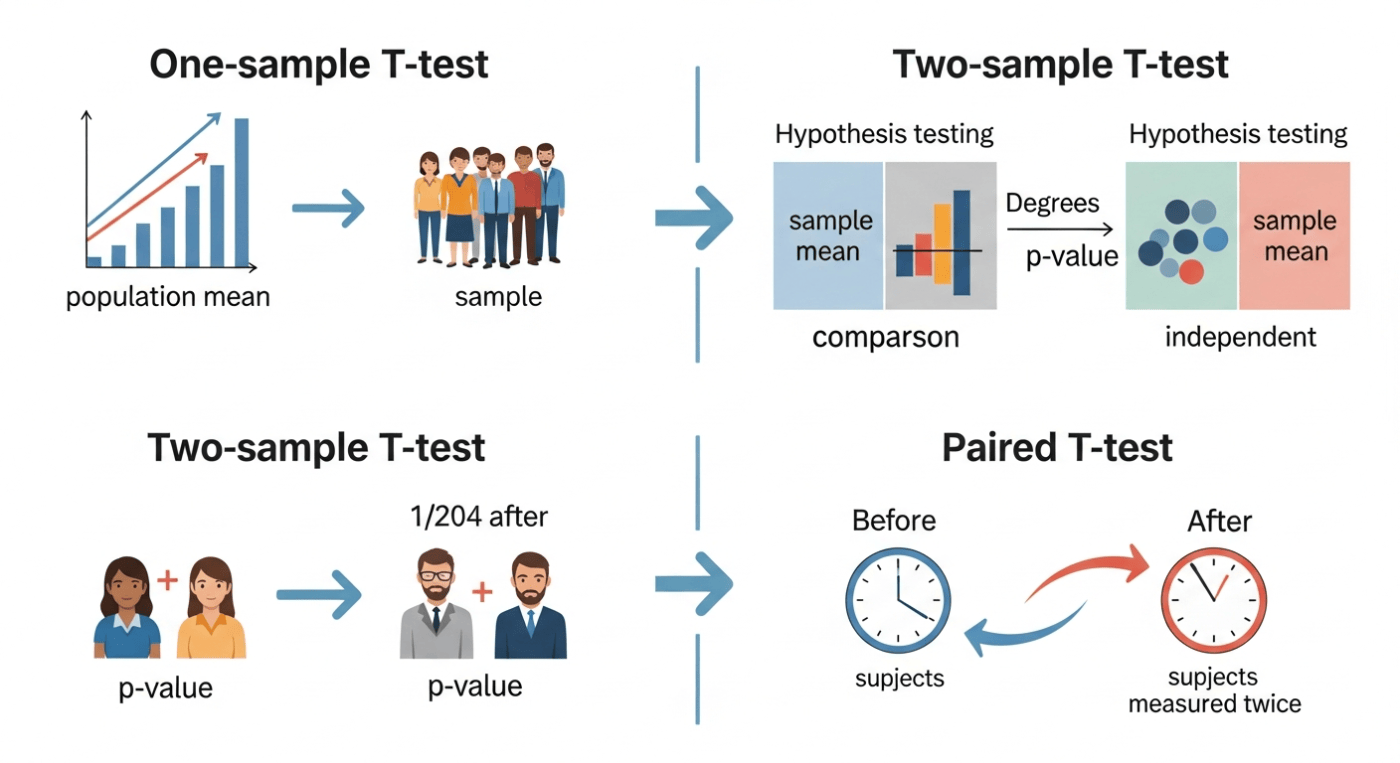
A t-test helps you compare averages between groups to see if the differences are real or just random chance. Whether you test a new feature on a website, evaluate a medical trial, or analyze student test scores, t-tests give you statistical proof to back up your decisions.
Understanding how to choose and run the right test saves you time and prevents false conclusions. Here is a clear guide to how t-tests work, the three main types, and how to use them in real scenarios.
What Is a T-Test?
A t-test is a statistical tool used to test hypotheses about sample means. It calculates a statistic (called a t-value) that compares the difference between group averages against the variation inside those groups.
- Null Hypothesis ($H_0$): Assumes there is no real difference between the means. Any observed gap comes purely from random chance.
- Alternative Hypothesis ($H_a$): Assumes a real difference exists between the group averages.
- P-Value: Tells you the probability that your results happened by luck. A p-value below 0.05 usually means your result is statistically significant.
If the variation inside your groups is low and the gap between their averages is large, your t-value goes up. A higher t-value means your results are less likely to be a random fluke.
The Three Main Types of T-Tests
Choosing the correct test depends on how many groups you have and whether those samples depend on each other.
1. One-Sample T-Test
Use a one-sample test when comparing the mean of a single group against a known standard or population baseline.
- Scenario: A factory claims its energy bars weigh 50 grams.
- Test: You weigh 30 random bars from the assembly line and compare their average weight against the target value of 50 grams.
2. Independent Samples T-Test (Two-Sample T-Test)
Use an independent samples test when comparing the means of two separate, unrelated groups.
- Scenario: Testing two different marketing emails.
- Test: Group A sees Subject Line 1, while Group B sees Subject Line 2. You compare the average open rates of both distinct groups.
3. Paired Samples T-Test (Dependent T-Test)
Use a paired test when taking two measurements from the exact same group at different points in time (such as before-and-after studies).
- Scenario: Testing a new training program on runner speeds.
- Test: You record sprint times for 20 athletes before the training program starts, then measure the sprint times of those same 20 athletes after six weeks.
Summary of T-Test Types
| T-Test Type | Groups Compared | Sample Relationship | Common Use Case |
| One-Sample | One sample vs. known value | N/A | Quality control checking against standards |
| Independent Two-Sample | Two separate groups | Completely independent | A/B testing website designs or products |
| Paired Samples | One group at two times | Dependent (Same subjects) | Before-and-after medical or training tests |
Key Assumptions Before Running a T-Test
For your t-test results to remain valid, your data must satisfy four core conditions:
- Continuous Data: Your dependent variable must be measured on a continuous scale (like height, weight, test scores, or revenue).
- Random Sampling: Your data points should come from a random selection of the broader population.
- Normal Distribution: The data should follow a standard bell curve. Larger sample sizes (usually over 30 points) help lower sensitivity to minor skews.
- Equal Variance: For independent two-sample tests, both groups should show similar levels of variance. If variances differ wildly, run a Welch’s t-test instead.
Step-by-Step Example: Running an Independent T-Test
Imagine you run an e-commerce website. You want to know if changing your checkout button from blue to green increases average customer spending.
Step 1: Set Up Hypotheses
- Null Hypothesis: Green and blue buttons yield the exact same average order value.
- Alternative Hypothesis: Green buttons yield a higher average order value than blue buttons.
Step 2: Collect Your Sample Data
You track two independent user groups over a week:
- Group A (Blue Button): 35 users, Average Spend = $42, Standard Deviation = $8
- Group B (Green Button): 35 users, Average Spend = $48, Standard Deviation = $9
Step 3: Calculate the T-Statistic
The formula for an independent samples t-test compares the difference between sample means ($\bar{X}_1 – \bar{X}_2$) to the pooled standard error ($s_p$):
$$t = \frac{\bar{X}_1 – \bar{X}_2}{\sqrt{\frac{s_1^2}{n_1} + \frac{s_2^2}{n_2}}}$$
Plugging the numbers into an online T Test Calculator yields a calculated t-value of roughly -2.95.
Step 4: Interpret the P-Value
With 68 degrees of freedom ($n_1 + n_2 – 2$), a t-value of -2.95 generates a p-value of roughly 0.004. Because 0.004 is well below your standard 0.05 threshold, you reject the null hypothesis. The green button produces a statistically significant increase in customer spending.
One-Tailed vs. Two-Tailed T-Tests
When setting up your calculation, you must choose between a one-tailed or two-tailed test direction.
- Two-Tailed Test: Tests for any difference between groups, regardless of direction. Use this option when you want to know if Group A is either higher or lower than Group B.
- One-Tailed Test: Tests for a difference in one specific direction (e.g., proving Group B is strictly greater than Group A). Use this option only when you have a clear directional hypothesis beforehand.
How to Report Your Findings
When sharing t-test results in academic papers or business reports, include the test type, degrees of freedom, t-statistic, and p-value.
- Standard Format: t(degrees of freedom) = t-value, p = p-value.
- Example Output: “An independent-samples t-test showed a significant difference in spending between green buttons ($M = 48, SD = 9$) and blue buttons ($M = 42, SD = 8$), $t(68) = 2.95, p = .004$.”
Using t-tests cuts out guesswork when analyzing data. Pick the right test variant based on your group setup, verify your distribution assumptions, and rely on statistical significance to guide your business decisions.


Leave a Reply